
Prospective Setups for 1/9/24
Market Surprises with Strong and Broad Bullish Momentum
Setup Skew
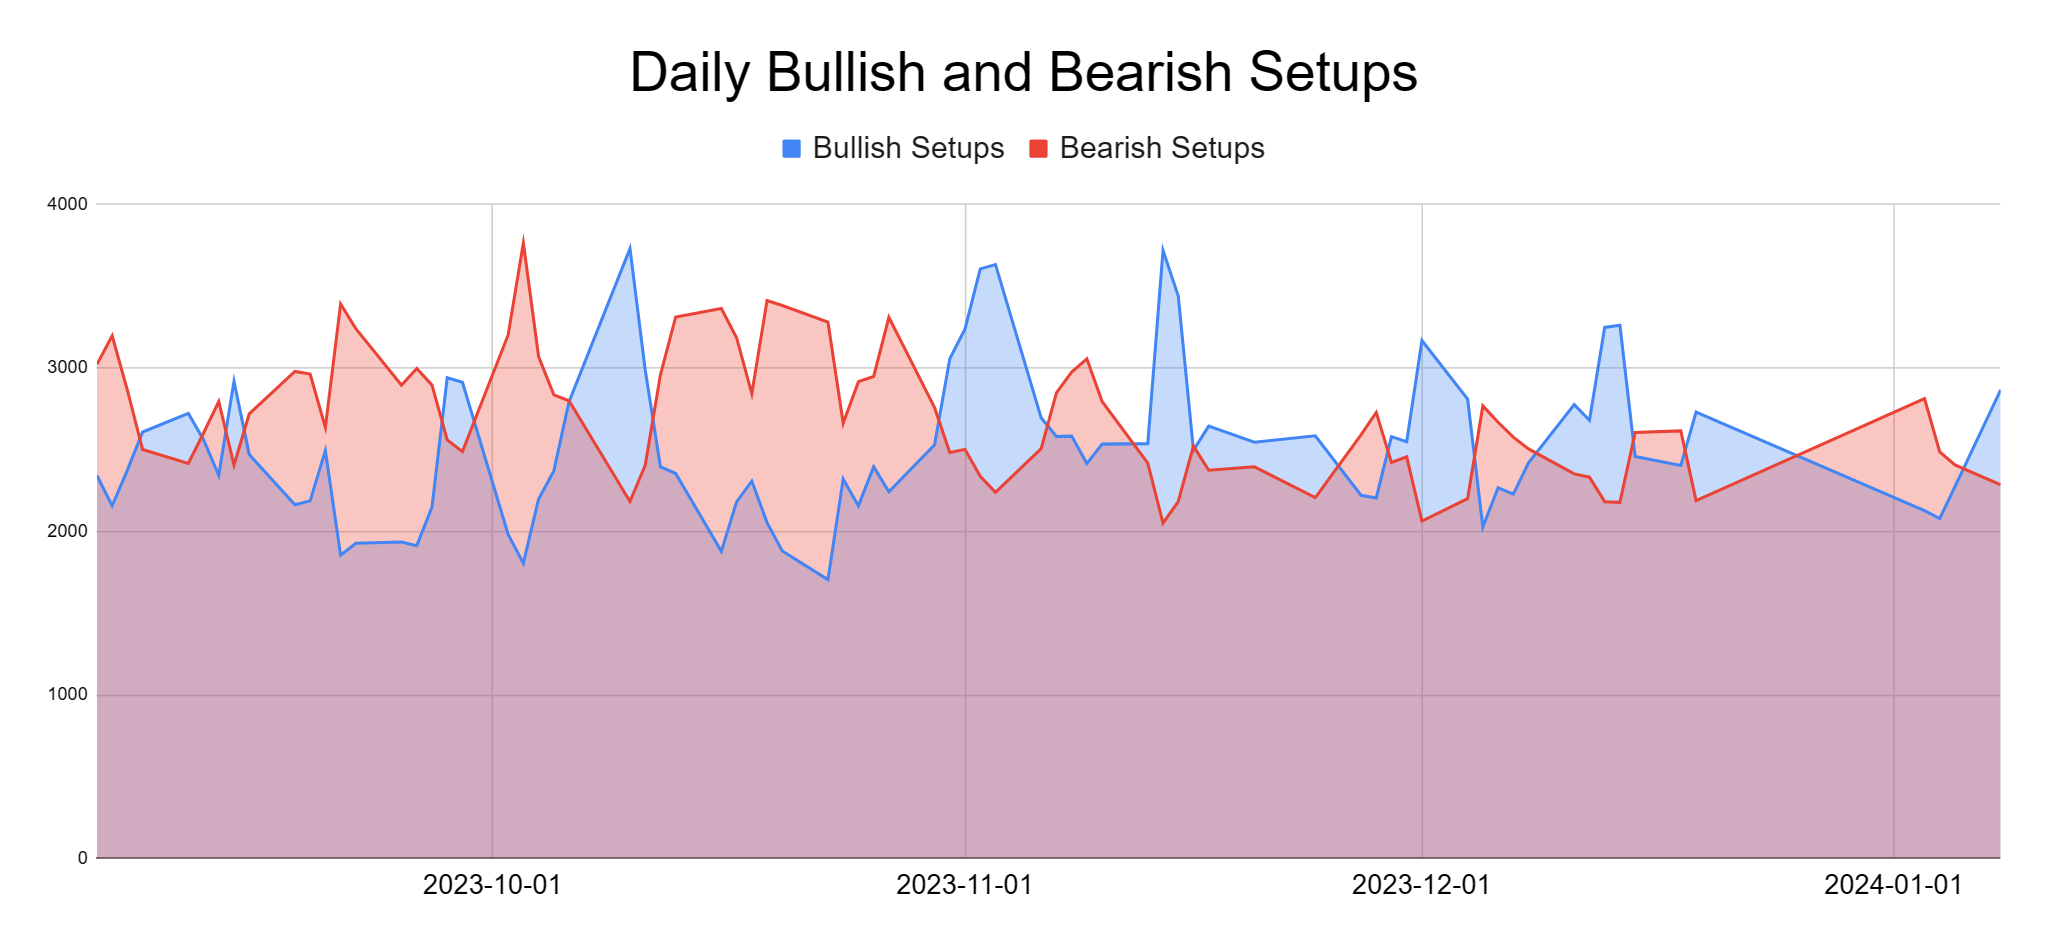
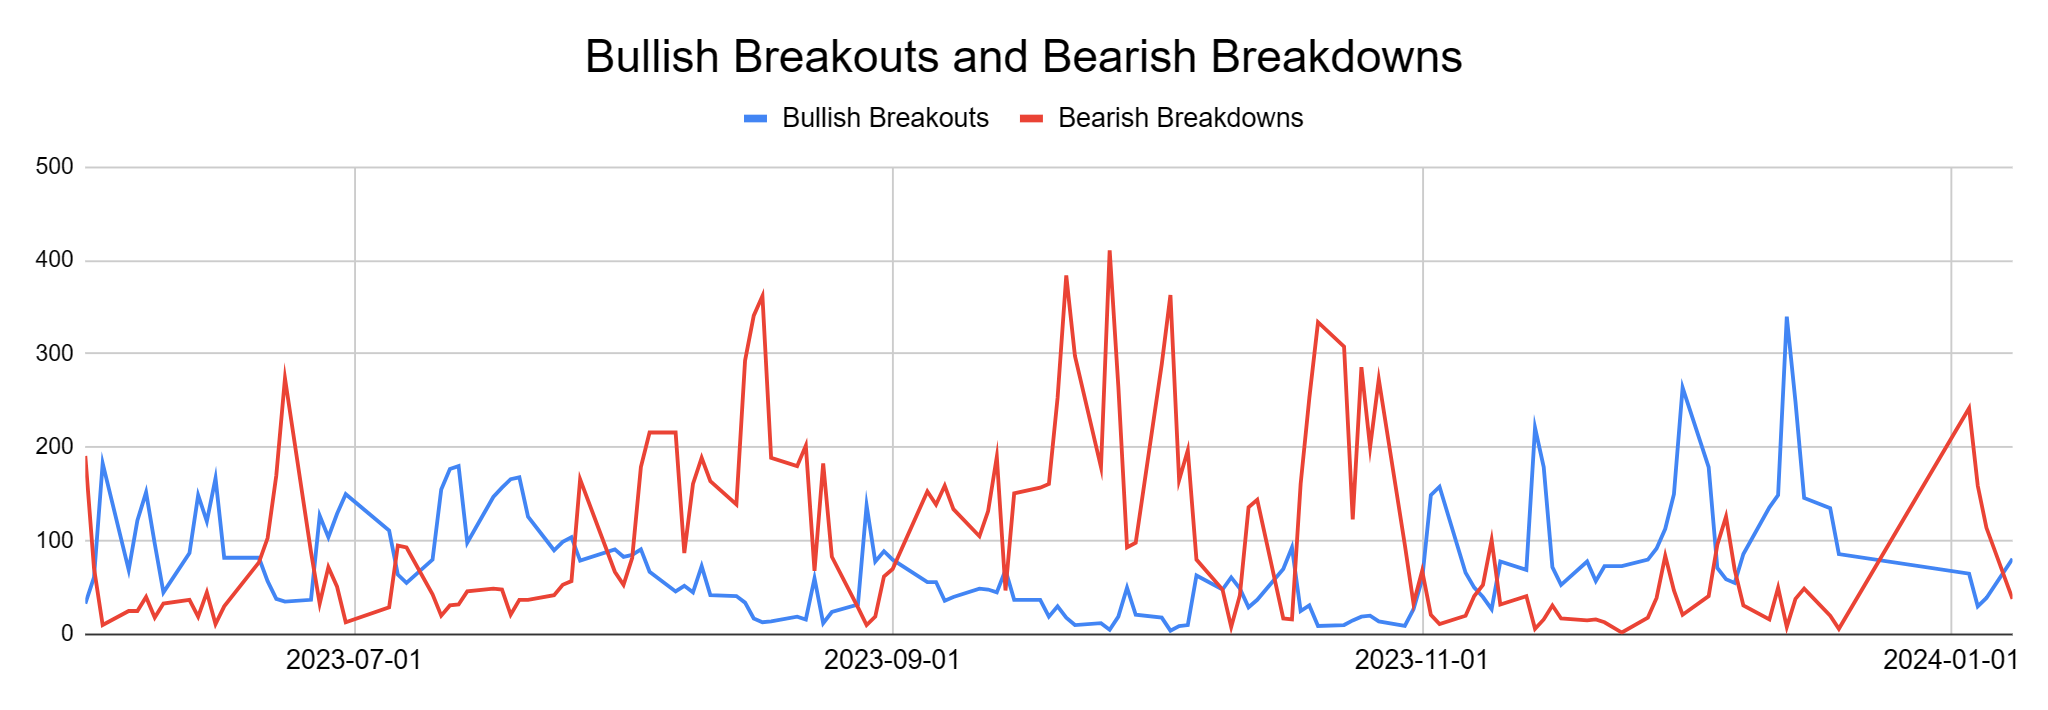
Today was a strong and broad bullish grind higher. Surprised me for sure. We have a 25.4% bullish setup bias for Tuesday’s trading (chart #1 below). Bullish breakouts (81) were more than 2x the number of bearish breakdowns (38) (chart #3 below).
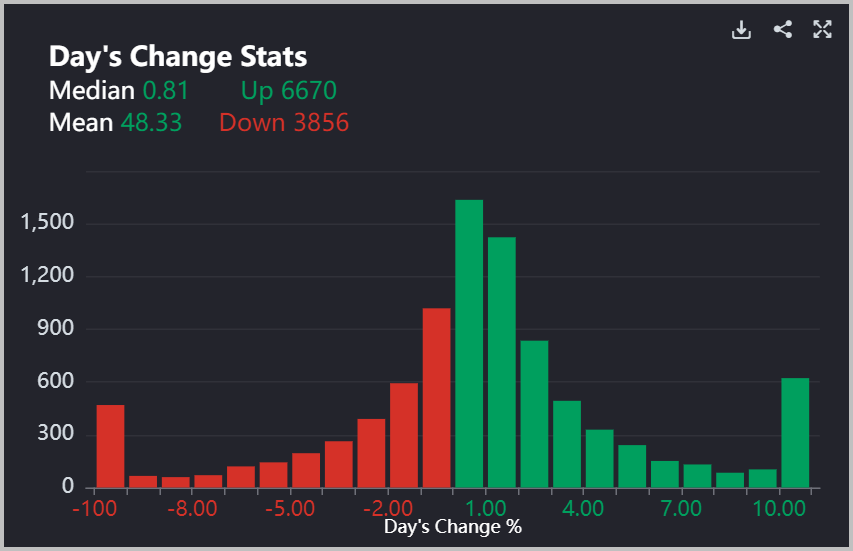
The number of bullish breakouts has now crossed up through the descending bearish breakdown line. And advancers broadly outpaced decliners (chart #2 below).
Today’s one of those day’s where you’d like to pop off about how great your bullish picks were from yesterday…and then you look at your bearish picks…and they went up too, so you keep mouth shut and change the subject to the Buffalo Bills finishing strong, winning their last six games. How bout those Bills.
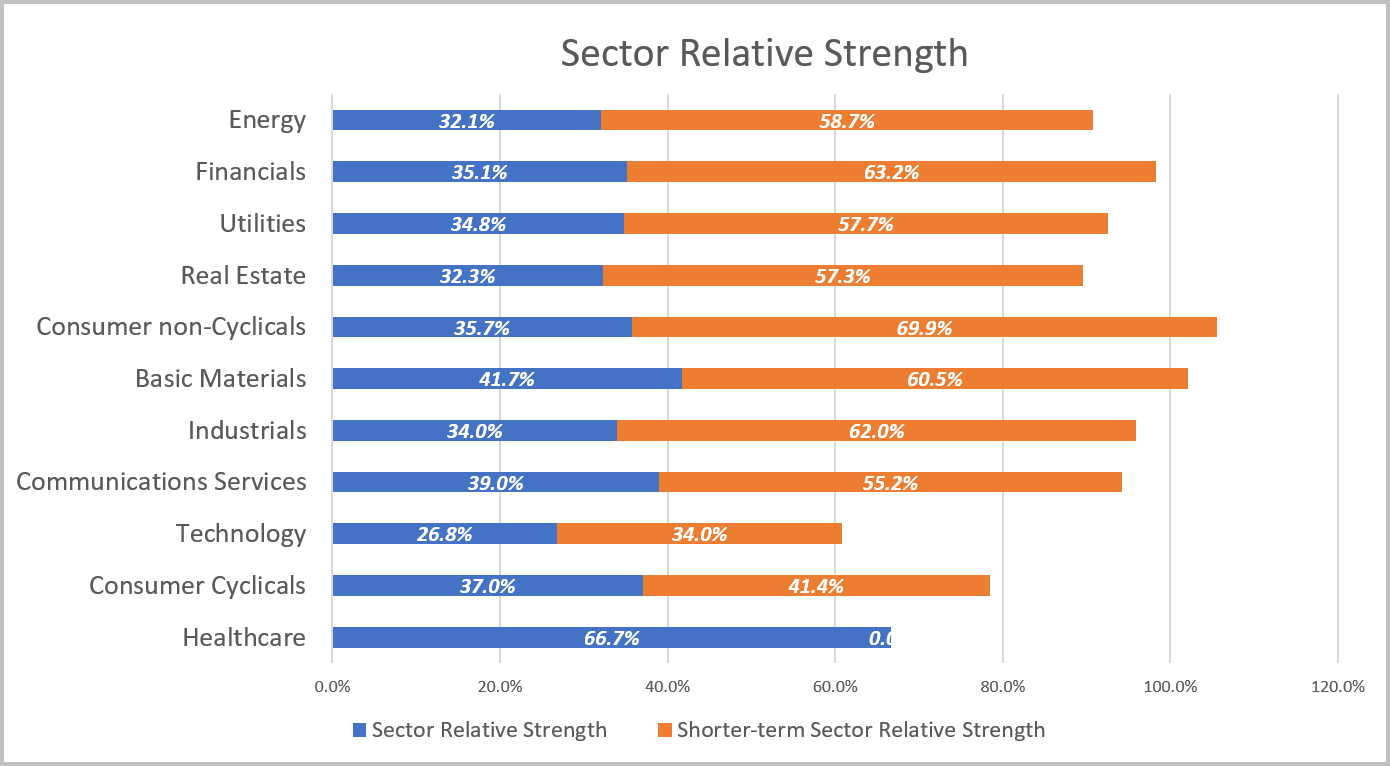
In / Out of Favor Sectors
Click here for link to Prospective Setups spreadsheet…

Debit Spread Prospective Trade
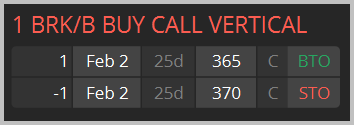
I’m considering a bull call debit spread on Birkshire Hathway (BRK.B) similar to the structure below; I’d pay no more than $2.50 per spread and set a target profit of $4.85 if filled on the entry.
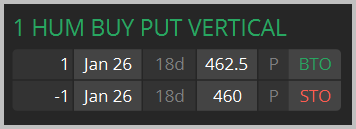
I’m considering a bear put debit spread on Humana (HUM) similar to the structure below; I’d pay no more than $1.25 per spread and set a target profit of $2.45 if filled on the entry. Note, this close to the same trade as yesterday. With earnings season, it is important but difficult to find stocks that will not be reporting earnings in the window needed to run the trade.
Covered Call Prospective Trade
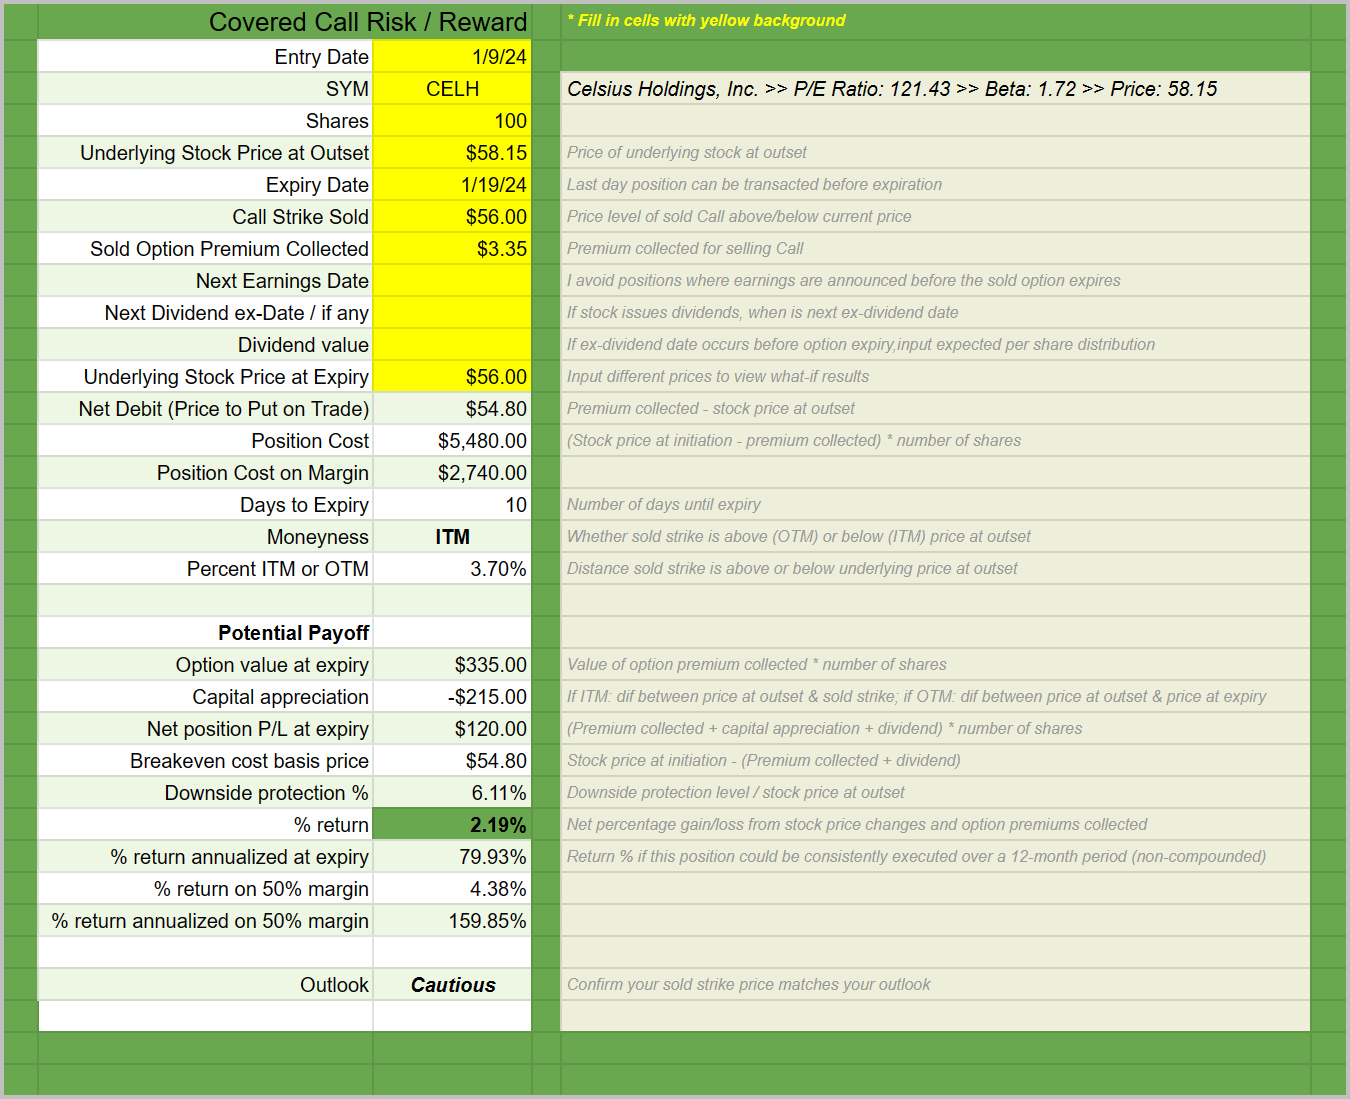
I’m considering a covered call in Celsius (CELH) tomorrow where I’d:
Pick up shares for about $58.5
Sell the 19 JAN $56 strike call for about $3.35
This cautious, in-the-money position yields about 2.1% (79% annualized) in 10 days if we’re able to get these fills and if CELH is at/above 56 on expiry.
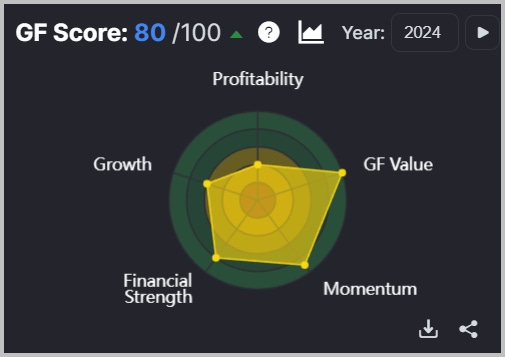
Celsius Holdings, a player in the health and wellness sector, exhibits a robust financial performance amid evolving market dynamics. The company's revenue growth is commendable, driven by the increasing consumer shift towards healthier beverage options. However, a deep dive into the financials reveals a higher reliance on a specific product line, posing a potential vulnerability if market preferences shift. This emerges as a notable weakness.
Analyzing the competitive landscape, Celsius Holdings benefits from a first-mover advantage in the fitness drink segment, fostering brand loyalty. The rising demand for functional beverages presents a significant opportunity for sustained growth. Yet, the threat of increased competition looms, as established players and new entrants seek to capitalize on this trend.
Conducting a SWOT analysis, the company's strengths lie in its innovative product offerings and a loyal customer base. Weaknesses include product concentration, while opportunities reside in expanding into untapped markets. Threats encompass intensifying competition and regulatory challenges.
Applying valuation methods, including discounted cash flow and ratios, suggests a fair valuation. The absence of excessive overvaluation, coupled with the company's durable competitive advantages, aligns with Warren Buffet's investment principles.
In summary, while Celsius Holdings navigates a competitive landscape, its strategic positioning and innovation present an appealing investment opportunity. However, investors should remain vigilant to industry trends and potential shifts in consumer preferences. The stock, with its strengths and weaknesses, offers a compelling case for further consideration, contingent upon one's risk appetite and investment horizon.
Thought from Jean-Jacques Rousseau
Formerly, when I would feel a desire to understand someone, or myself, I would take into consideration not actions, in which everything is relative, but wishes. Tell me what you want and I’ll tell you who you are.

Take this newsletter on the go with the Substack app.

Use this QR code to download the Substack app on iPhone or Android.

Substack app on Apple App Store
Substack app on Google Play Store
Help
Use the Spreadsheet: Click the link above (orange text)! If you’re reading this email, 80% of any value you can extract from it is stored in the spreadsheet where I update six tabs of stock analysis daily (the rest of the stuff here is just me blathering on about who knows what…) So, click the link and work the spreadsheet to create your own watchlists. You can create your own single-metric analysis score by ranking four metrics from 0 to 5. It’s a great shortcut for finding setups you’re interested in.
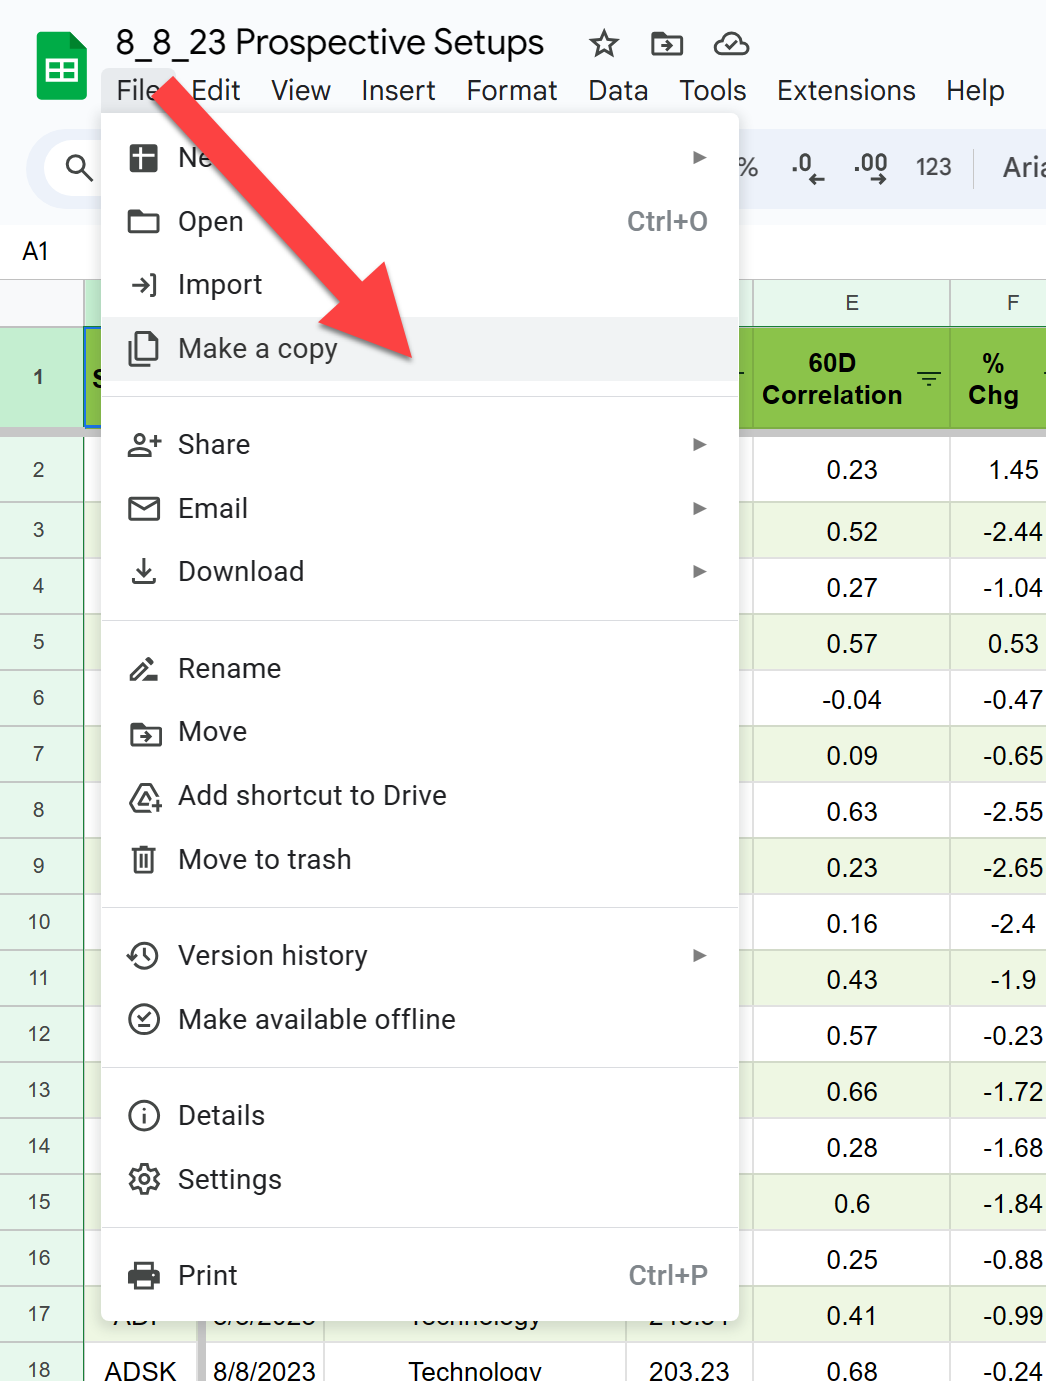
Make a Copy:
Make a copy of the spreadsheet as a reference by choosing “Make a copy” from the File menu (File >> Make a copy). No one else, including me, can view any edits or changes you make. The copy is saved to your Google drive, available to only you.

Reminders on Spreadsheet Columns
Use the Spreadsheet: Click the link. If you’re opening this email, 90% of any value you can extract from it is stored in the spreadsheet where I update six tabs of stock analysis daily. You can create your own single-metric analysis score by ranking four metrics from 0 to 5.
Make a Copy: Make a copy of the spreadsheet as a reference by choosing “Make a copy” from the File menu (File >> Make a copy). No one else, including me, can view any edits or changes you make. The copy is saved to your Google drive, available to only you.
Paired Setups (Bull TTL & Bear TTL): The Paired Setups column is the net number of screens triggering on the current day registering either one or more bullish or bearish mean reversion setups. There are 24 bullish mean reversion setups (the “Bull TTL” column) and 24 bearish (the “Bear TTL column”). The sum of these columns is the Paired Setups column value.
NOTE: these screens were selected from a collection of more than 800 screens. They only measure historic performance and not future projections.
60D Correlation: A 60-day price correlation with the S&P 500 is a measure of how closely the price of a stock has moved with the price of the S&P 500 over the past 60 days. A correlation of 1 means that the two prices have moved perfectly in lockstep, a correlation of 0 means that they have moved completely independently of each other, and a correlation of -1 means that they have moved in opposite directions.
Beta: Beta is a measure of the volatility of a stock's price relative to the overall market. A beta of 1 means that the stock's price moves in the same direction as the market, with the same degree of volatility. A beta of greater than 1 means that the stock's price is more volatile than the market, and a beta of less than 1 means that the stock's price is less volatile than the market.
For example, if a stock has a beta of 1.5, that means that the stock's price is expected to move 1.5 times as much as the market. Stocks with high betas are considered more risky than stocks with low betas as high-beta stocks are more likely to experience large price swings, both up and down.
Investors who are looking for stocks with low risk should consider investing in stocks with low betas. These stocks are less likely to experience large price swings, which may help to protect investors' portfolios from larger losses.
My Summary Score: The last five columns of the tables are for creating your own final ranking score. Just apply a ranking from 0 - 5 on how highly you want to rank a given measure and those individual values will get aggregated into your own personal score in column S.
A higher value means the metric is more important. Then sorting from Z >> A in column S will surface your highest ranked prospects to the top.